

Orologio con SVG e JavaScript
Questo orologio è simile al precedente ma utilizza, al posto dei canvas, il tag HTML SVG (Scalable Vector Graphics).
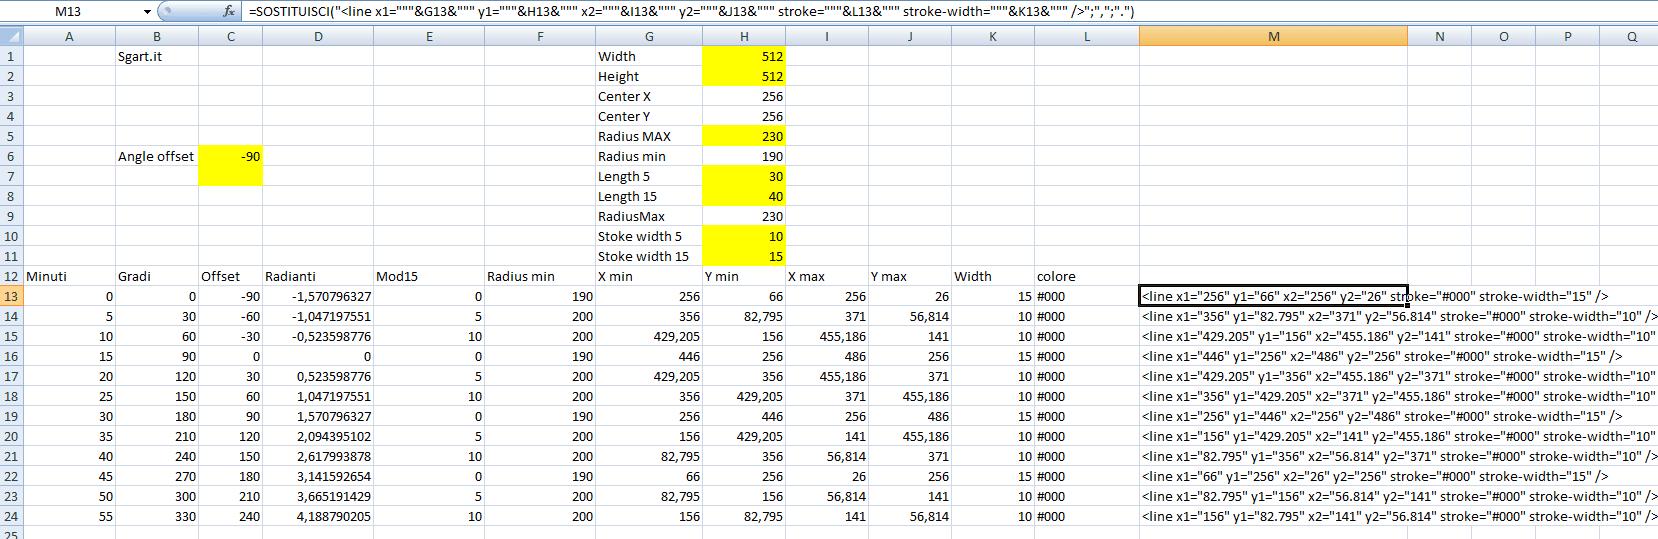
Excel per calcoli
Il tag SVG è vettoriale e quindi nativamente scalabile a piacere senza perdita di qualità grafica.
Interfaccia
Il tag HTML per realizzare il disegno dell'orologio è questoHTML
<svg version="1.1" viewBox="0 0 512 512" xmlns="http://www.w3.org/2000/svg" width="100%" hight="100%" id="sgart-clock">
	<style>
		.text { font-family: Arial, Helvetica, sans-serif; font-size: 22px; font-weight: bold;}
	</style>
	<g>
		<!-- sfondo e bordo esterno -->
		<circle cx="256" cy="256" r="255" />
		<circle cx="256" cy="256" r="240" fill="#eee" />
	</g>
	<g>
		<!-- linee dei 5 minuti -->
		<line x1="256" y1="66" x2="256" y2="26" stroke="#000" stroke-width="15" />
		<line x1="356" y1="82.795" x2="371" y2="56.814" stroke="#000" stroke-width="10" />
		<line x1="429.205" y1="156" x2="455.186" y2="141" stroke="#000" stroke-width="10" />
		<line x1="446" y1="256" x2="486" y2="256" stroke="#000" stroke-width="15" />
		<line x1="429.205" y1="356" x2="455.186" y2="371" stroke="#000" stroke-width="10" />
		<line x1="356" y1="429.205" x2="371" y2="455.186" stroke="#000" stroke-width="10" />
		<line x1="256" y1="446" x2="256" y2="486" stroke="#000" stroke-width="15" />
		<line x1="156" y1="429.205" x2="141" y2="455.186" stroke="#000" stroke-width="10" />
		<line x1="82.795" y1="356" x2="56.814" y2="371" stroke="#000" stroke-width="10" />
		<line x1="66" y1="256" x2="26" y2="256" stroke="#000" stroke-width="15" />
		<line x1="82.795" y1="156" x2="56.814" y2="141" stroke="#000" stroke-width="10" />
		<line x1="156" y1="82.795" x2="141" y2="56.814" stroke="#000" stroke-width="10" />
	</g>
	<g>
		<!-- lancette ore, minuti e secondi con relativo id per animazione in JavaScript -->
		<line x1="256" y1="256" x2="256" y2="430" stroke="#333" stroke-width="15" id="sgart-clock-hours" />
		<line x1="256" y1="256" x2="256" y2="70" stroke="#000" stroke-width="10" id="sgart-clock-minutes" />
		<line x1="256" y1="256" x2="430" y2="256" stroke="#F00" stroke-width="5" id="sgart-clock-seconds" />
	</g>
	<g>
		<!-- cerchio lancette -->
		<circle cx="256" cy="256" r="15" />
		<!-- testi -->
		<text x="256" y="155" textLenght="300" text-anchor="middle" class="text" fill="#800">sgart.it</text>
		<text x="256" y="357" textLenght="300" text-anchor="middle" class="text" fill="#888" id="sgart-clock-text">00:00:00</text>
	</g>
</svg>
Animazione
Per animare le lancette serve un po' di JavaScript per ricalcolare ogni volta la posizione X e Y delle lancette usando le funzioni Math.cos(rad) e Math.sin(rad)JavaScript
const updateClock = ()=>{
	const width = 512;
	const height = 512;
	const centerX = width /2;
	const centerY = height /2;
	const dt = new Date();

	const setCoords = (elmId, num60, radius) => {
		const rad = (Math.PI / 30) * (num60+45);

		const x = centerX + Math.cos(rad) * radius;
		const y = centerY + Math.sin(rad) * radius;
		//console.log(x, y);

		const elm = document.getElementById(elmId);
		// aggiorno le coordinate
		elm.setAttribute("x2", x);
		elm.setAttribute("y2", y);
	};

	// second
	const radiusSecond = 200;
	const seconds = dt.getSeconds();
	setCoords("sgart-clock-seconds", seconds, radiusSecond);

	// minutes
	const radiusMinutes = 186;
	const minutes = dt.getMinutes();
	setCoords("sgart-clock-minutes", minutes, radiusMinutes);

	// hours
	const radiusHours = 150;
	const hours = dt.getHours();
	const hoursRad = (60/12) * (hours % 12) + (minutes * 5/60);
	setCoords("sgart-clock-hours", hoursRad, radiusHours);

	// text
	// console.log(dt.getHours(), minutes, seconds);
	const elmClockText = document.getElementById("sgart-clock-text");
	elmClockText.innerHTML = (hours<10?"0":"") + hours + ":" + (minutes<10?"0":"") + minutes + ":" +(seconds<10?"0":"") + seconds;
};
// forzo l'aggiornamento immediato
updateClock();
// richiamo ogni tot tempo l'aggiornamento
setInterval(updateClock, 250);
Creazione SVG
Per creare velocemente il disegno dell'orologio, in particolare per calcolare le posizioni X e Y di ogni tacca dei 5 minuti, ho usato un foglio Excel dove, dopo aver eseguito tutti i calcoli, genero il tag SVG line- Gradi = 360/60*A13
- Offset = B13+$C$6
- Radianti = PI.GRECO()/180*C13
- Mod15 = RESTO(A13;15)
- Radius min = $H$5-SE(E13=0;$H$8;$H$7)
- X min = ARROTONDA(COS($D13)*F13; 3)+$H$3
- Y min = ARROTONDA(SEN($D13)*F13;3)+$H$4
- X max = ARROTONDA(COS($D13)*$H$5;3)+$H$3
- Y max = ARROTONDA(SEN($D13)*$H$5;3)+$H$4
- Width = SE(E13=0;$H$11;$H$10)
- Colore = #000
- Tag = =SOSTITUISCI("<line x1="""&G13&""" y1="""&H13&""" x2="""&I13&""" y2="""&J13&""" stroke="""&L13&""" stroke-width="""&K13&""" />";",";".")